

By Suhas Kulkarni, FIMMTECH
Consider a crystal of ice at – 20 deg C. If we gradually increase the temperature of this crystal, then at 0 deg C, the ice turns to water. This is a phase transition. The molecules have transitioned from one phase to another phase because of the addition of thermal energy. This is called a thermal phase transition.
Polymers too can exist in different phases. The temperature of liquid nitrogen is anywhere between, -345 to -320 deg F (-210 to -195 deg C). When a water hose, used for the water lines on a mold, is dropped into liquid nitrogen, gets very brittle. If you drop this hose on to a concrete floor, it shatters like glass into pieces sounding as if someone dropped a glass tube. This phase that the rubber exists in is called the ‘Glassy State’. All polymers in their glassy state are brittle. In this state, the molecules have very little energy and are therefore immobile.
As we increase the temperature of the rubber hose and bring it to room temperature, the molecules gain more and more energy and become flexible. This state is called the ‘Rubbery or Viscoelastic State’. Here the molecules have sufficient energy to move and be flexible. The temperature at which the molecules transition from a glassy state to a rubbery state is called the Glass Transition Temperature or the Tg.
Further increase in temperature, provides more energy to the molecules and the rubber will now melt (For simplicity we are assuming that the hose is made out of a thermoplastic, non cross linked material). This is the melt phase. The temperature at which the molecules transition from a rubbery state to a melt state is called the melt temperature or the Tm.
The crystallites in crystalline materials need a known definite amount of energy to melt. When they receive this in the form of a thermal energy they melt all at once. For this reason, crystalline materials show a sharp melting point. In case of amorphous materials, because of the absence of crystallites, the transition to the melt is much more gradual and therefore there is no sharp melting point. They soften over a wide range of temperature. This difference between the crystalline and amorphous materials leads to the fact that crystalline materials have a much narrower melt processing window as compared to amorphous materials. For example, a nylon (crystalline) will have a melt processing window of from 480 to 510 deg F as compared to an ABS (Amorphous) with a window from 400 to 475 deg F; 30 deg F for nylon compared to 75 deg F for ABS. Moreover, you can safely go slightly above or below the recommended temperatures for the amorphous materials but not so in case the crystalline materials.
When a crystallite melts, the molecules are no longer in any definite arrangement and the melt is now amorphous. Therefore, in the melt phase any polymer, crystalline or amorphous, will always exist in the amorphous phase. Liquid Crystal Polymers or LCPs are an exception to this.
Now, let us consider the reverse process of phase transitions. If we have a melt of a crystalline polymer and the temperature is now gradually reduced, the molecular energy starts to reduce. The viscosity of the melt starts to increase and the crystallites begin to reappear. The temperature at which the crystallites occur is called the Crystallization Temperature or the Tc.
For the product designer, the Tg is one of the important factors of consideration. For a product to be flexible at room temperature, its Tg must be below room temperature, such as for elastomers. For a product to be rigid at room temperature, the Tg must be above the room temperature.
For the molder, the knowledge about the crystallization and melting temperatures is important since these dictate the processing conditions. The Tc is used to determine the mold temperature range to start and promote the crystallization of the molecules. The Tm is used to determine the melt temperature ranges. A processing datasheet does not have these as typical values but these are reflected under the processing conditions. The material manufacturer performs the analysis and uses the results as one of the many tests to recommend the processing conditions.
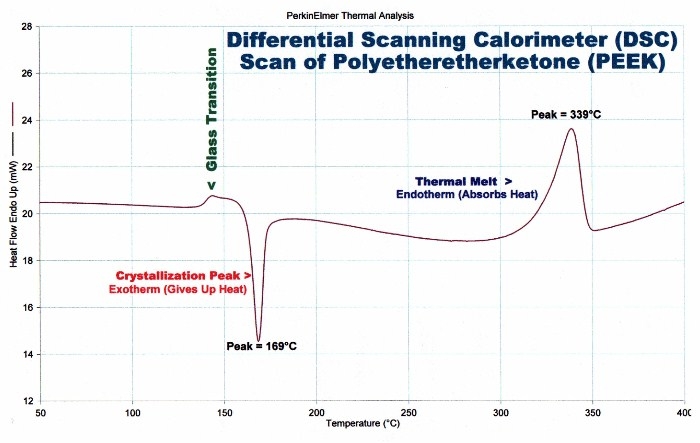
The Differential Scanning Calorimeter (DSC) is an instrument that is used to determine the thermal transitions in polymers. A typical graph generated by a DSC is shown below. For crystalline polymers, two scans are performed. During the first scan, the polymer is taken from a low set temperature all the way past the melting temperature, and the transitions are recorded. The sample, which is now in the molten form is then immediately quenched into liquid nitrogen. Most polymers are below the Tg at this temperature. Since the melt is amorphous and is immediately quenched, all the energy is taken away and the frozen polymer is also completely amorphous. The DSC scan is repeated. As the temperature increases, the molecules gain more and more energy, the glass transition is noticed and when the crystallization temperature is reached, the crystallites begin to form and is recorded on the graph. Crystallization temperatures are recorded on the second scan. For amorphous polymers, a second scan is not necessary.
About the Author
| Suhas Kulkarni FIMMTECH | Suhas Kulkarni is the President of FIMMTECH, a consulting firm that specializes in services related to injection molding. He earned his Masters in Plastics Engineering from the University of Massachusetts, Lowell and a Bachelors in Polymer Engineering from the University of Poona, India. He has 18 years of experience as a process engineer.His main area of expertise is Scientific Processing for Injection Molding. Based on his experience, he has developed a custom software called Nautilus, that aids the complete process development routine to production release.He also teaches a plastics and molding course at the University of California, San Diego and is a contract faculty at the University of Massachusetts at Lowell.
The company website is www.fimmtech.com and Suhas can be reached at 760-525-9053. Check out Suhas’s Free Global Resource for Injection Mold Processing at Injection Molding Online |
The views, opinions and technical analyses presented here are those of the author or advertiser, and are not necessarily those of ULProspector.com or UL Solutions. The appearance of this content in the UL Prospector Knowledge Center does not constitute an endorsement by UL Solutions or its affiliates.
All content is subject to copyright and may not be reproduced without prior authorization from UL Solutions or the content author.
The content has been made available for informational and educational purposes only. While the editors of this site may verify the accuracy of its content from time to time, we assume no responsibility for errors made by the author, editorial staff or any other contributor.
UL Solutions does not make any representations or warranties with respect to the accuracy, applicability, fitness or completeness of the content. UL Solutions does not warrant the performance, effectiveness or applicability of sites listed or linked to in any content.